World Megacities on the Climate Map: Where Does Tashkent Stand

The world’s major metropolises exist in diverse climate conditions. In some cities, hot and humid weather prevails year-round, while others are dominated by dry or cold conditions. A recently prepared infographic highlights these differences, dividing large cities into four main climate groups based on temperature and precipitation data.
The creators of the infographic analyzed 74 major cities worldwide. Using data from Climate-Data.org, the average annual temperature and yearly precipitation levels were calculated for each city. The cities were then systematically categorized based on their climatic characteristics.
The diagram consists of four main sections: dry and hot, humid and hot, dry and cold, and humid and cold. The vertical axis represents the city’s average annual temperature, while the horizontal axis shows the annual precipitation amount. This allows for a clear visualization of the "position" of each metropolis in terms of climate.
According to the analysis, the “humid and cold” group is the least populated among the major cities. Reykjavik, the capital of Iceland, is noted as the coldest metropolis in this quadrant, where temperatures remain low and precipitation levels are relatively high throughout the year.
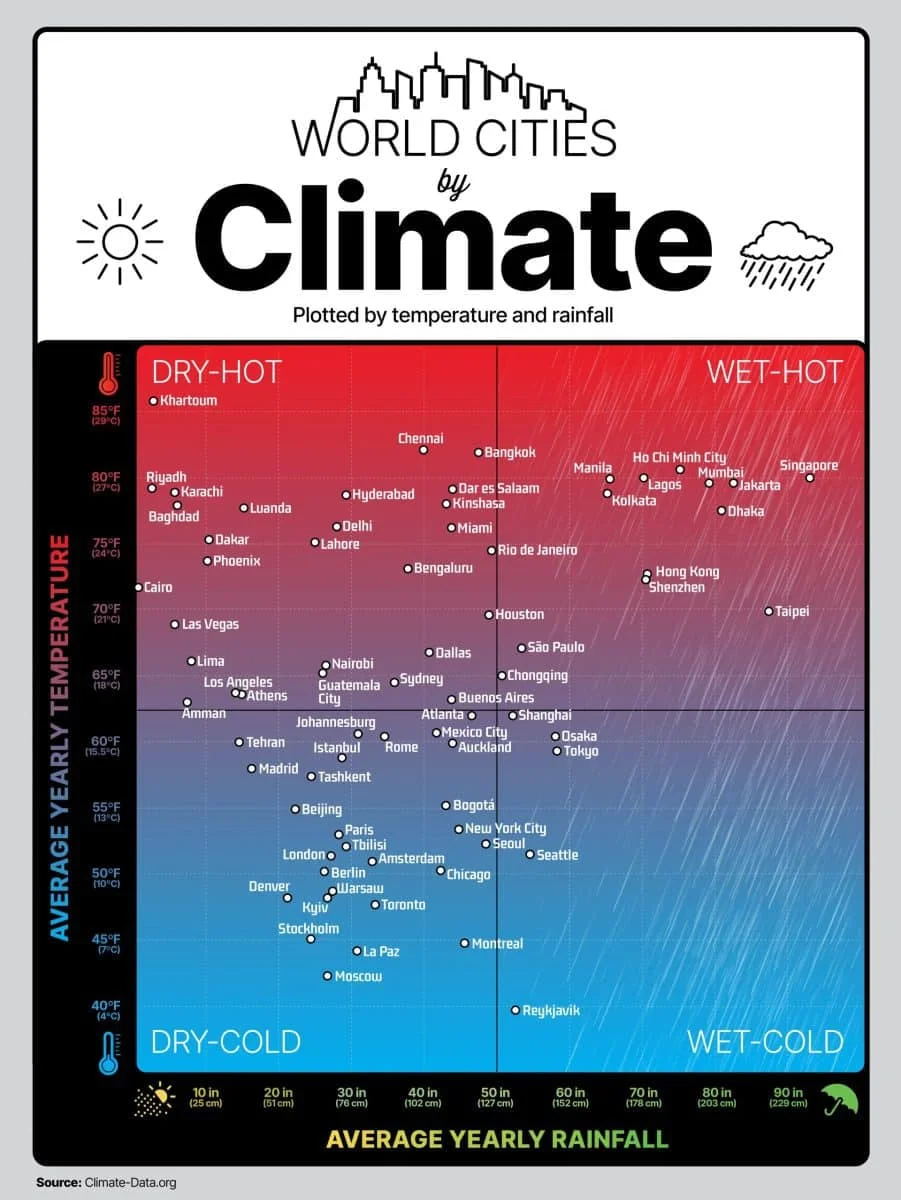
In the “dry and cold” category, Moscow is highlighted as the city with the lowest average temperature. Interestingly, many European cities fall into this climate group, where winters tend to be cold, and summers are often dry.
On the infographic, Tashkent is positioned in the lower-left section, within the “dry and cold (DRY-COLD)” quadrant. Its placement slightly below the “hot-cold” dividing line indicates that Tashkent’s average annual temperature is approximately 13–14°C. The yearly precipitation averages around 50–55 centimeters, or approximately 540 millimeters.
This position reflects Tashkent's dry continental climate. Summers are typically hot and have low rainfall, while winters are mild or cold. Due to lower precipitation levels compared to “humid” cities, Tashkent is classified as “dry,” and its moderate average temperature places it in the “cold” sector.
U.S. cities are predominantly located in the dry section of the diagram, spread across both the cold and hot quadrants. Khartoum, the capital of Sudan, is identified as the hottest metropolis in the dry region, with an average annual temperature of around 30°C.
This infographic is considered a significant resource for comparing urban climate conditions, understanding global climate differences, and anticipating how city environments may evolve in the future.


Comments 0
…