Claude can create diagrams in chat
Anthropic has updated its Claude AI chatbot with a new feature that lets it generate custom charts, diagrams, and other interactive visuals directly in conversations. Reports Theverge.com.
The AI will automatically insert these visuals inline when it determines they would be helpful based on the chat context. Users can also directly request a specific chart, table, or diagram at any time during their discussion.
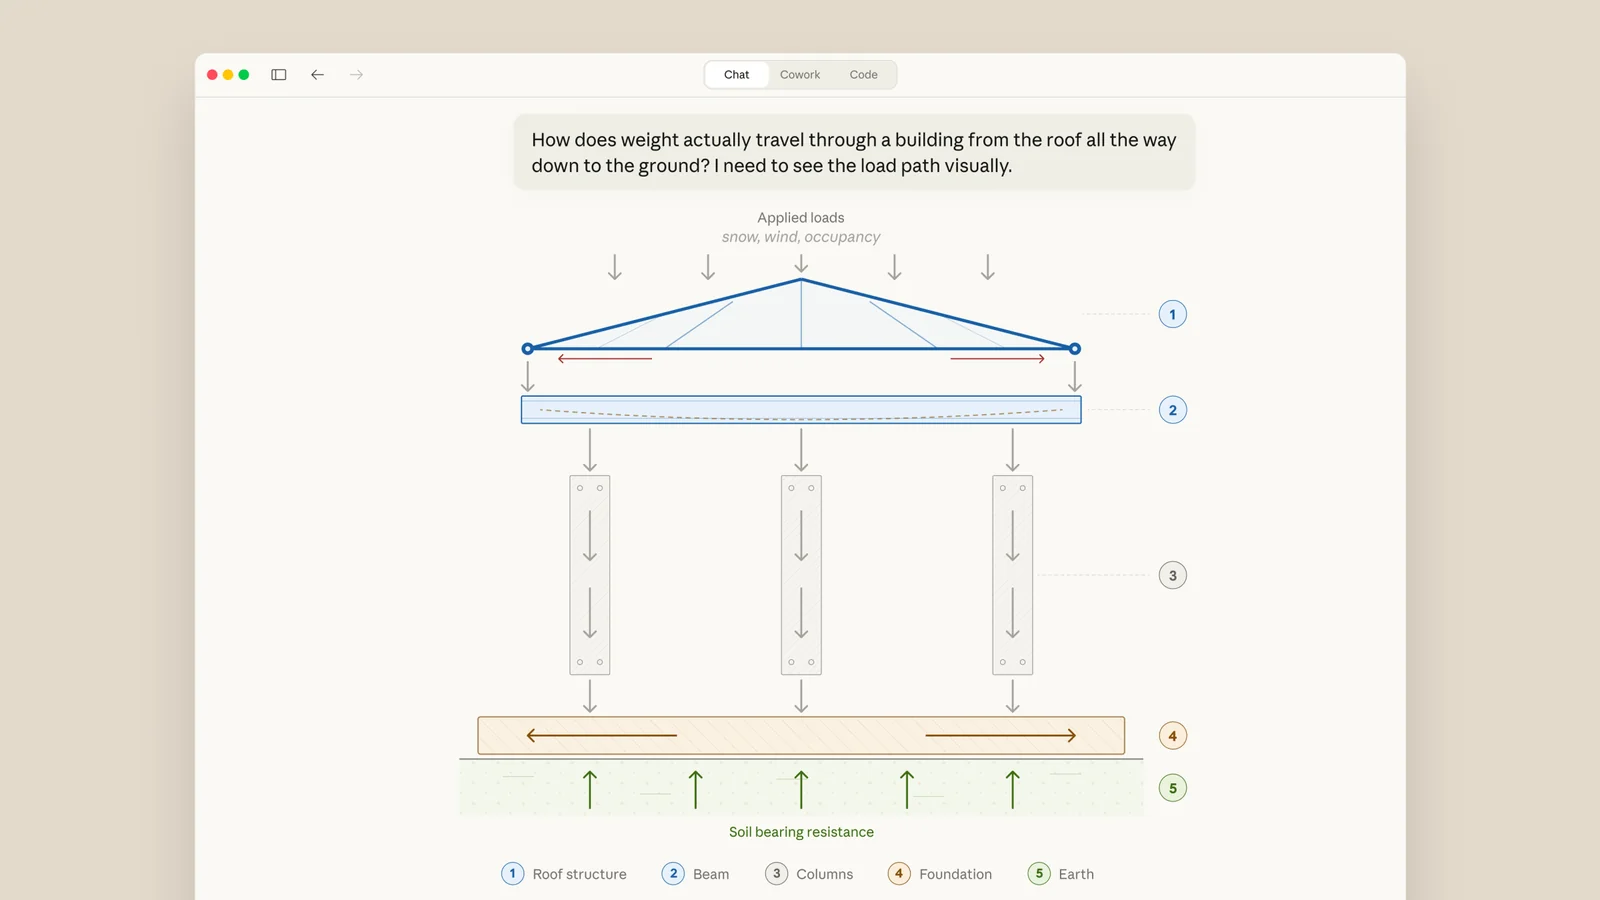
For instance, talking about the periodic table might prompt Claude to create an interactive version where users can click on elements for more details. In another case, it could visualize how weight is distributed through a building structure when asked about architecture or physics.
This new capability differs from Claude's existing artifacts feature, which creates persistent items like apps or documents in a separate side panel. The in-chat visualizations change or disappear as the conversation moves forward, though users can ask the AI to modify them.
The rollout is happening now for all Claude users and is enabled by default. The update comes shortly after similar visualization features were introduced in competing AI tools from OpenAI and Google.


Comments 0
…