


Elon Musk's xAI introduces Grok AI for Excel
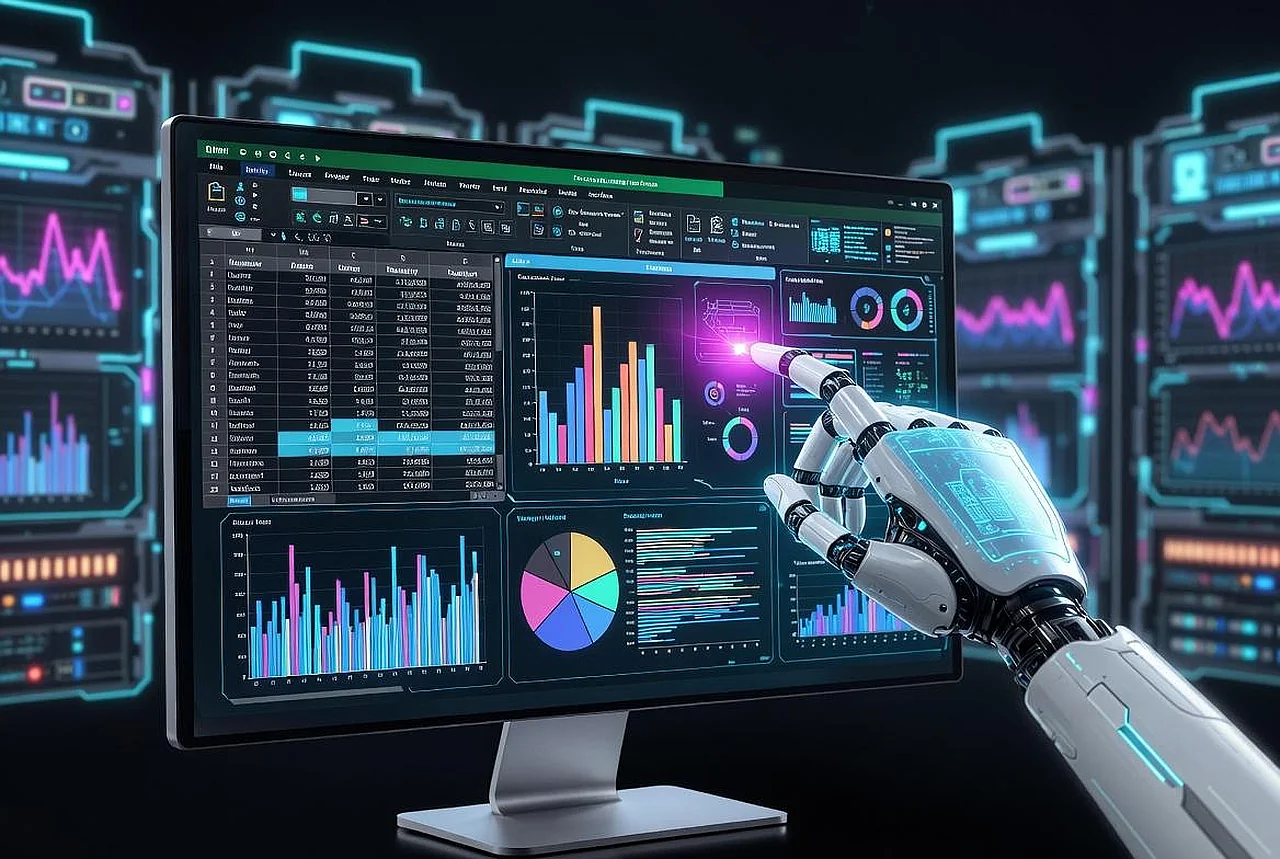
Elon Musk's xAI has announced the integration of its latest Grok 4.5 model with Microsoft Excel spreadsheets. This innovation fundamentally changes data processing, allowing complex calculations to be performed via simple text commands. Now, instead of writing formulas, users can simply provide instructions to the AI in natural language. This was reported by Ixbt.com reports .
Grok for Excel assists not only with simple calculations but also with deep financial analysis and market data research. The system can automatically generate complex formulas, model various business scenarios, and draw immediate conclusions based on input data. This provides significant convenience for economists and analysts working with large volumes of numbers.
A new level of data analysis
The uniqueness of the new feature lies in its ability to explain the reasons for revenue growth based on user queries, calculate average sales metrics by region, and build visual charts in seconds. Grok understands the user's task, independently modifies data in the spreadsheet, and provides the required result.According to ixbt.com, this integration is expected to become a serious competitor to Microsoft's own Copilot system. The capabilities of the Grok 4.5 model could increase efficiency within Excel tenfold, as it minimizes human error and automates difficult mathematical operations.
Grok stands out from other AI systems, particularly the ChatGPT model, in several aspects. It has access to real-time data from the X (formerly Twitter) social network, allowing it to analyze the latest news and trends. Additionally, Grok is known for its unique sense of humor and less censored responses.
This tool can also be very useful for users and local business representatives. Whether preparing financial reports, analyzing warehouse stock, or tracking sales dynamics, Grok offers the opportunity to save significant time. Currently, this feature is being rolled out gradually to xAI subscribers.
- Automatic creation of complex financial models;
- Building charts and graphs via text queries;
- Rapid statistical analysis by region and period;
- Forecasting business development scenarios.


Comments 0
…